Opportunity
Smart homes kitted out with internet-connected devices are no longer the stuff of science fiction. Heating is a particular area of interest, given the great potential to reduce energy usage. Several 'smart heating systems' are commercially available (Nest, EcoBee, tado, etc). One challenge not yet overcome is gaining the trust of users to leave the thermostat alone and allow the system to 'do its thing.'
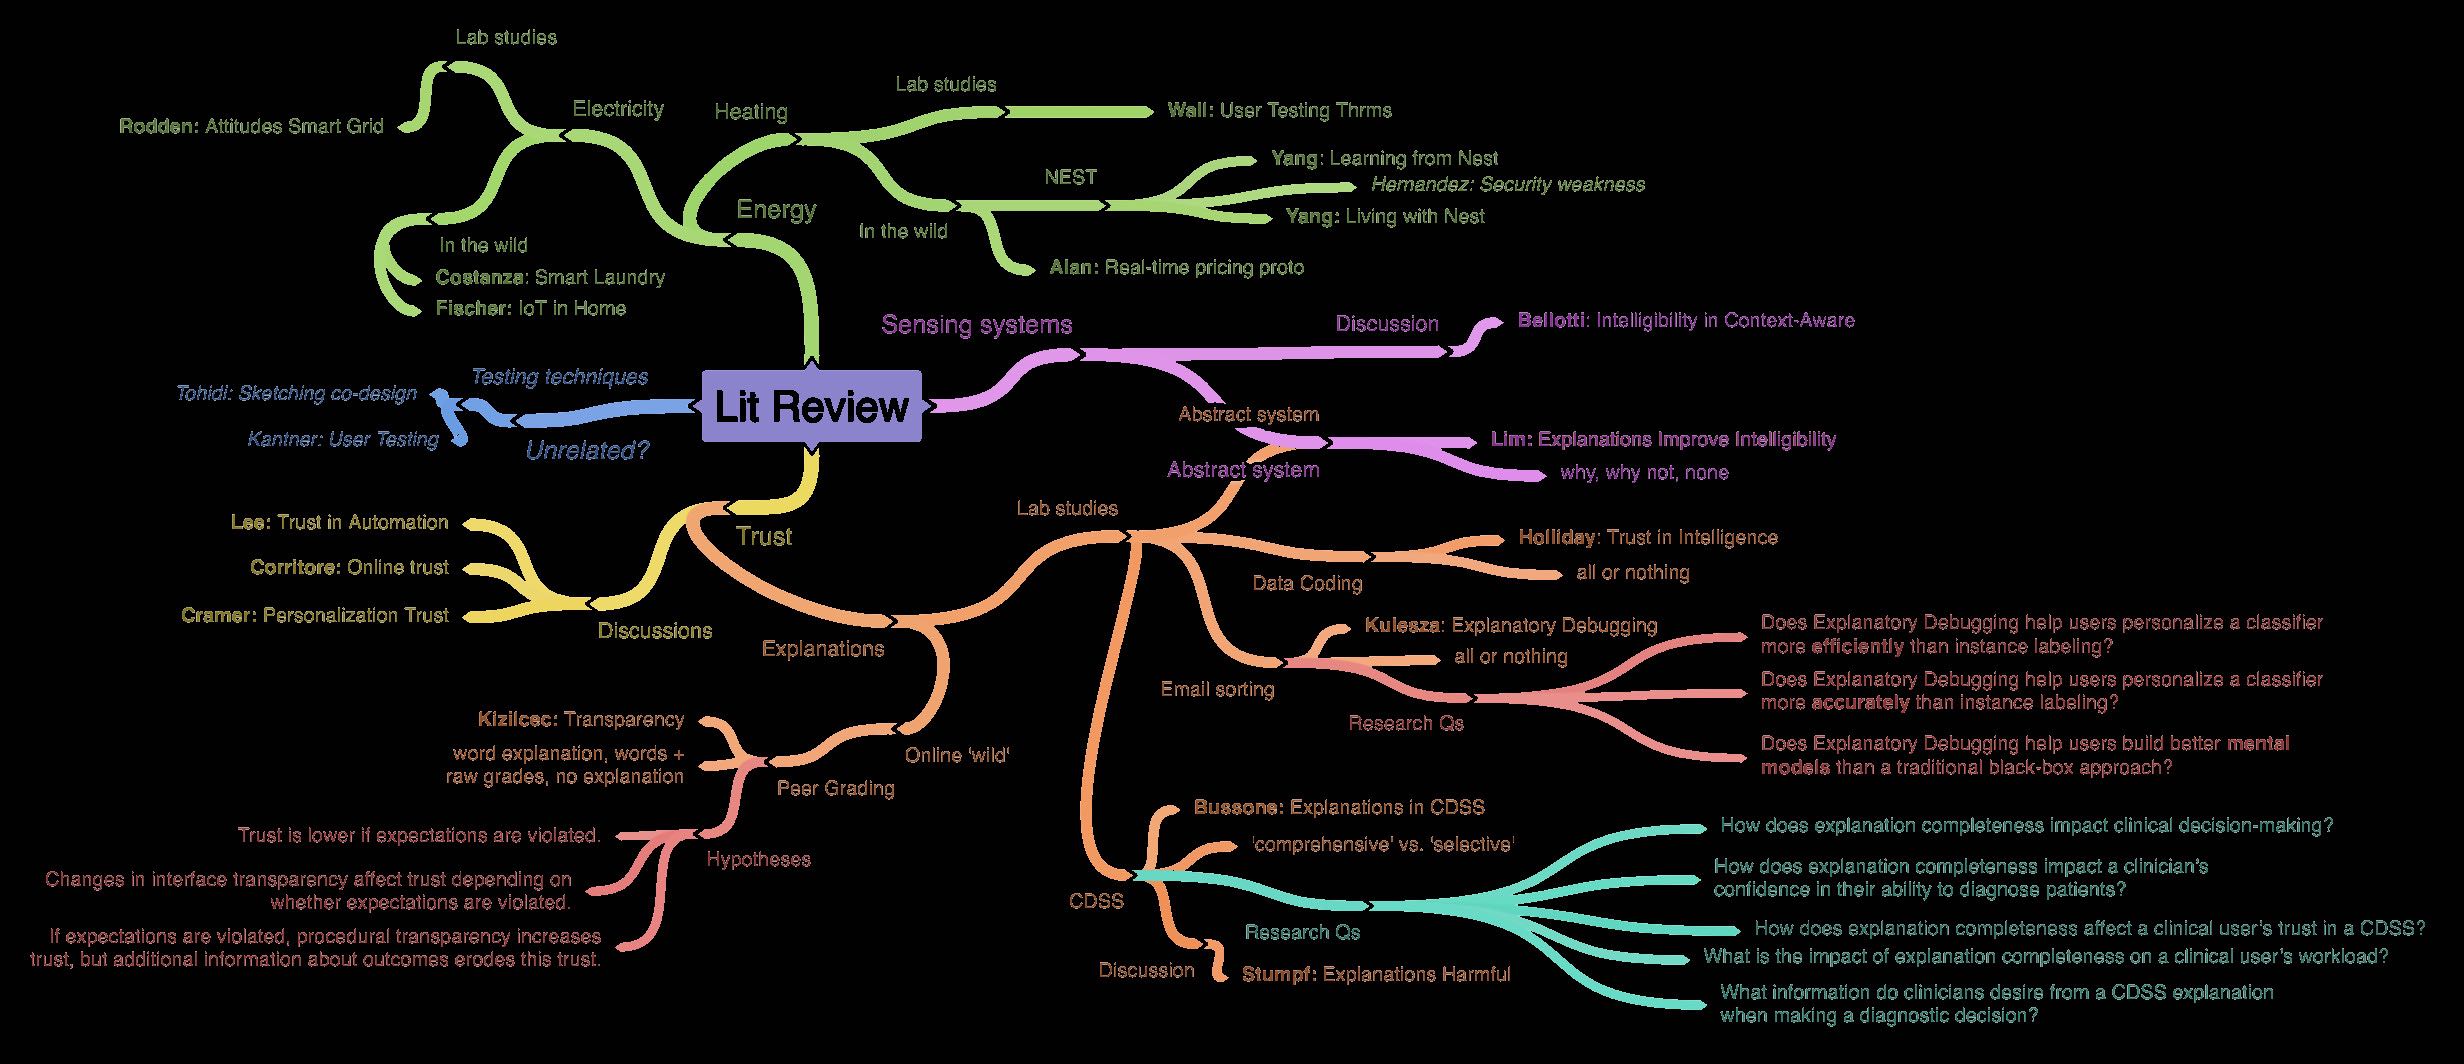
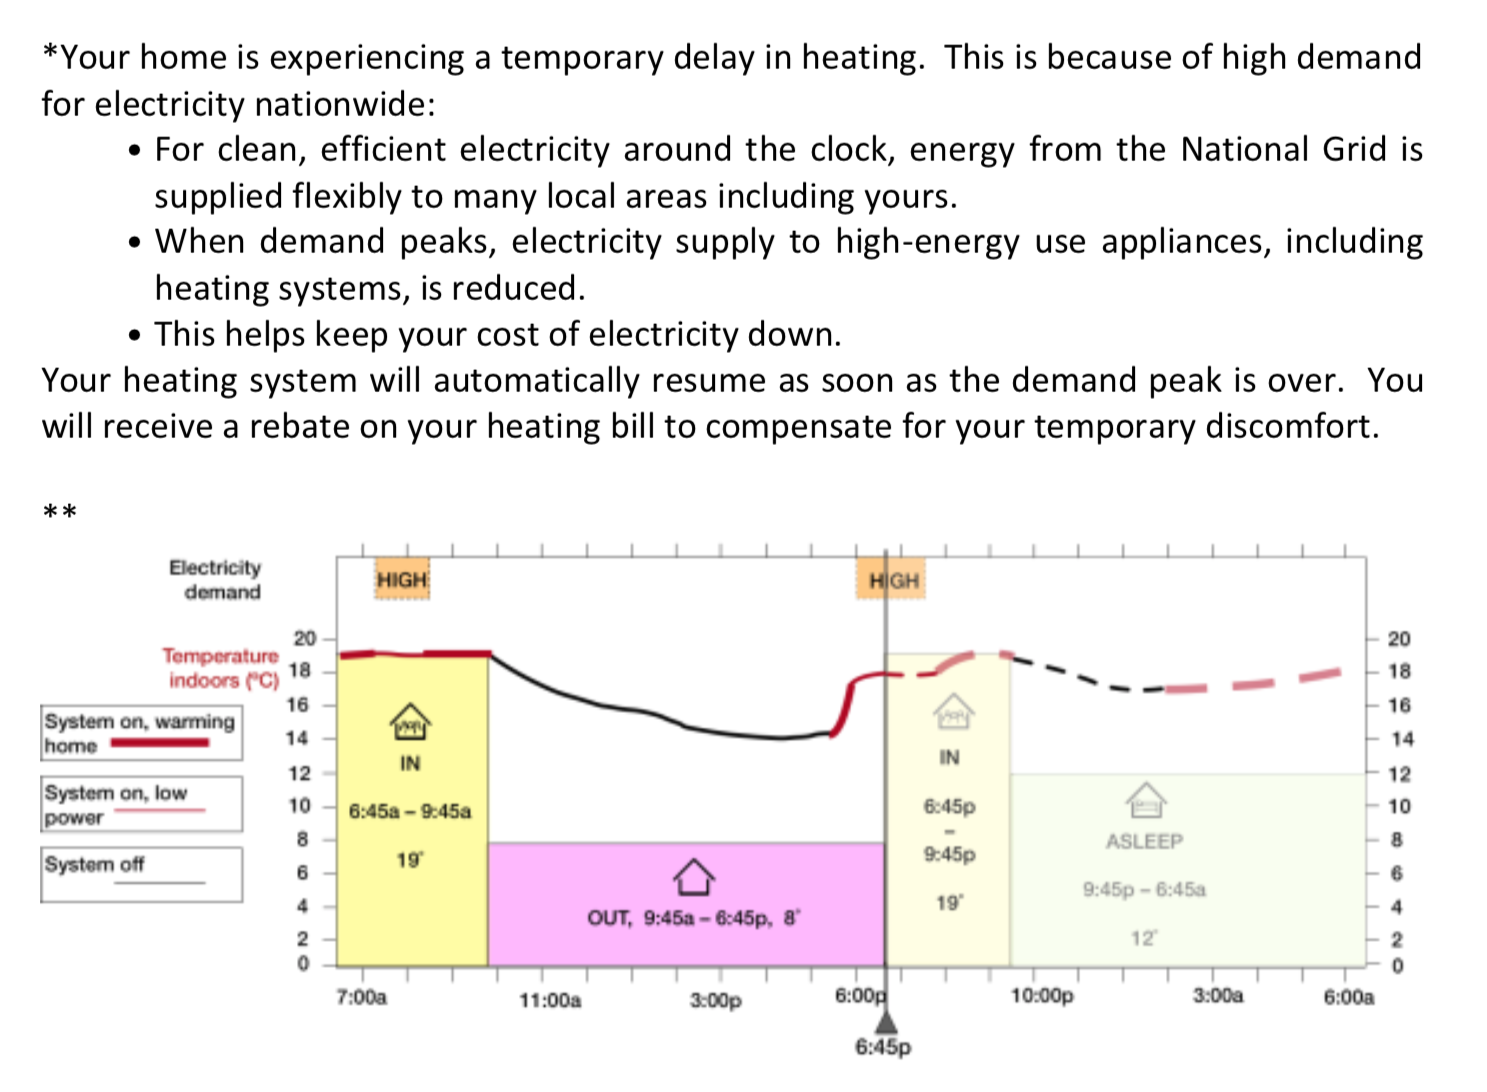
Dr. Simone Stumpf (my advisor) has worked on a whole host of projects regarding trust in smart systems: doctor diagnosis tools, music recommendation systems, email sorting algorithms, etc. She and others have found that explanations of what machine learning systems are doing tend to help people develop trust in these systems. Therefore, my project was to test whether explanations of a textual or graphical variety help users: (1) understand what the system is doing, and (2) trust the system to make decisions for them.
Process
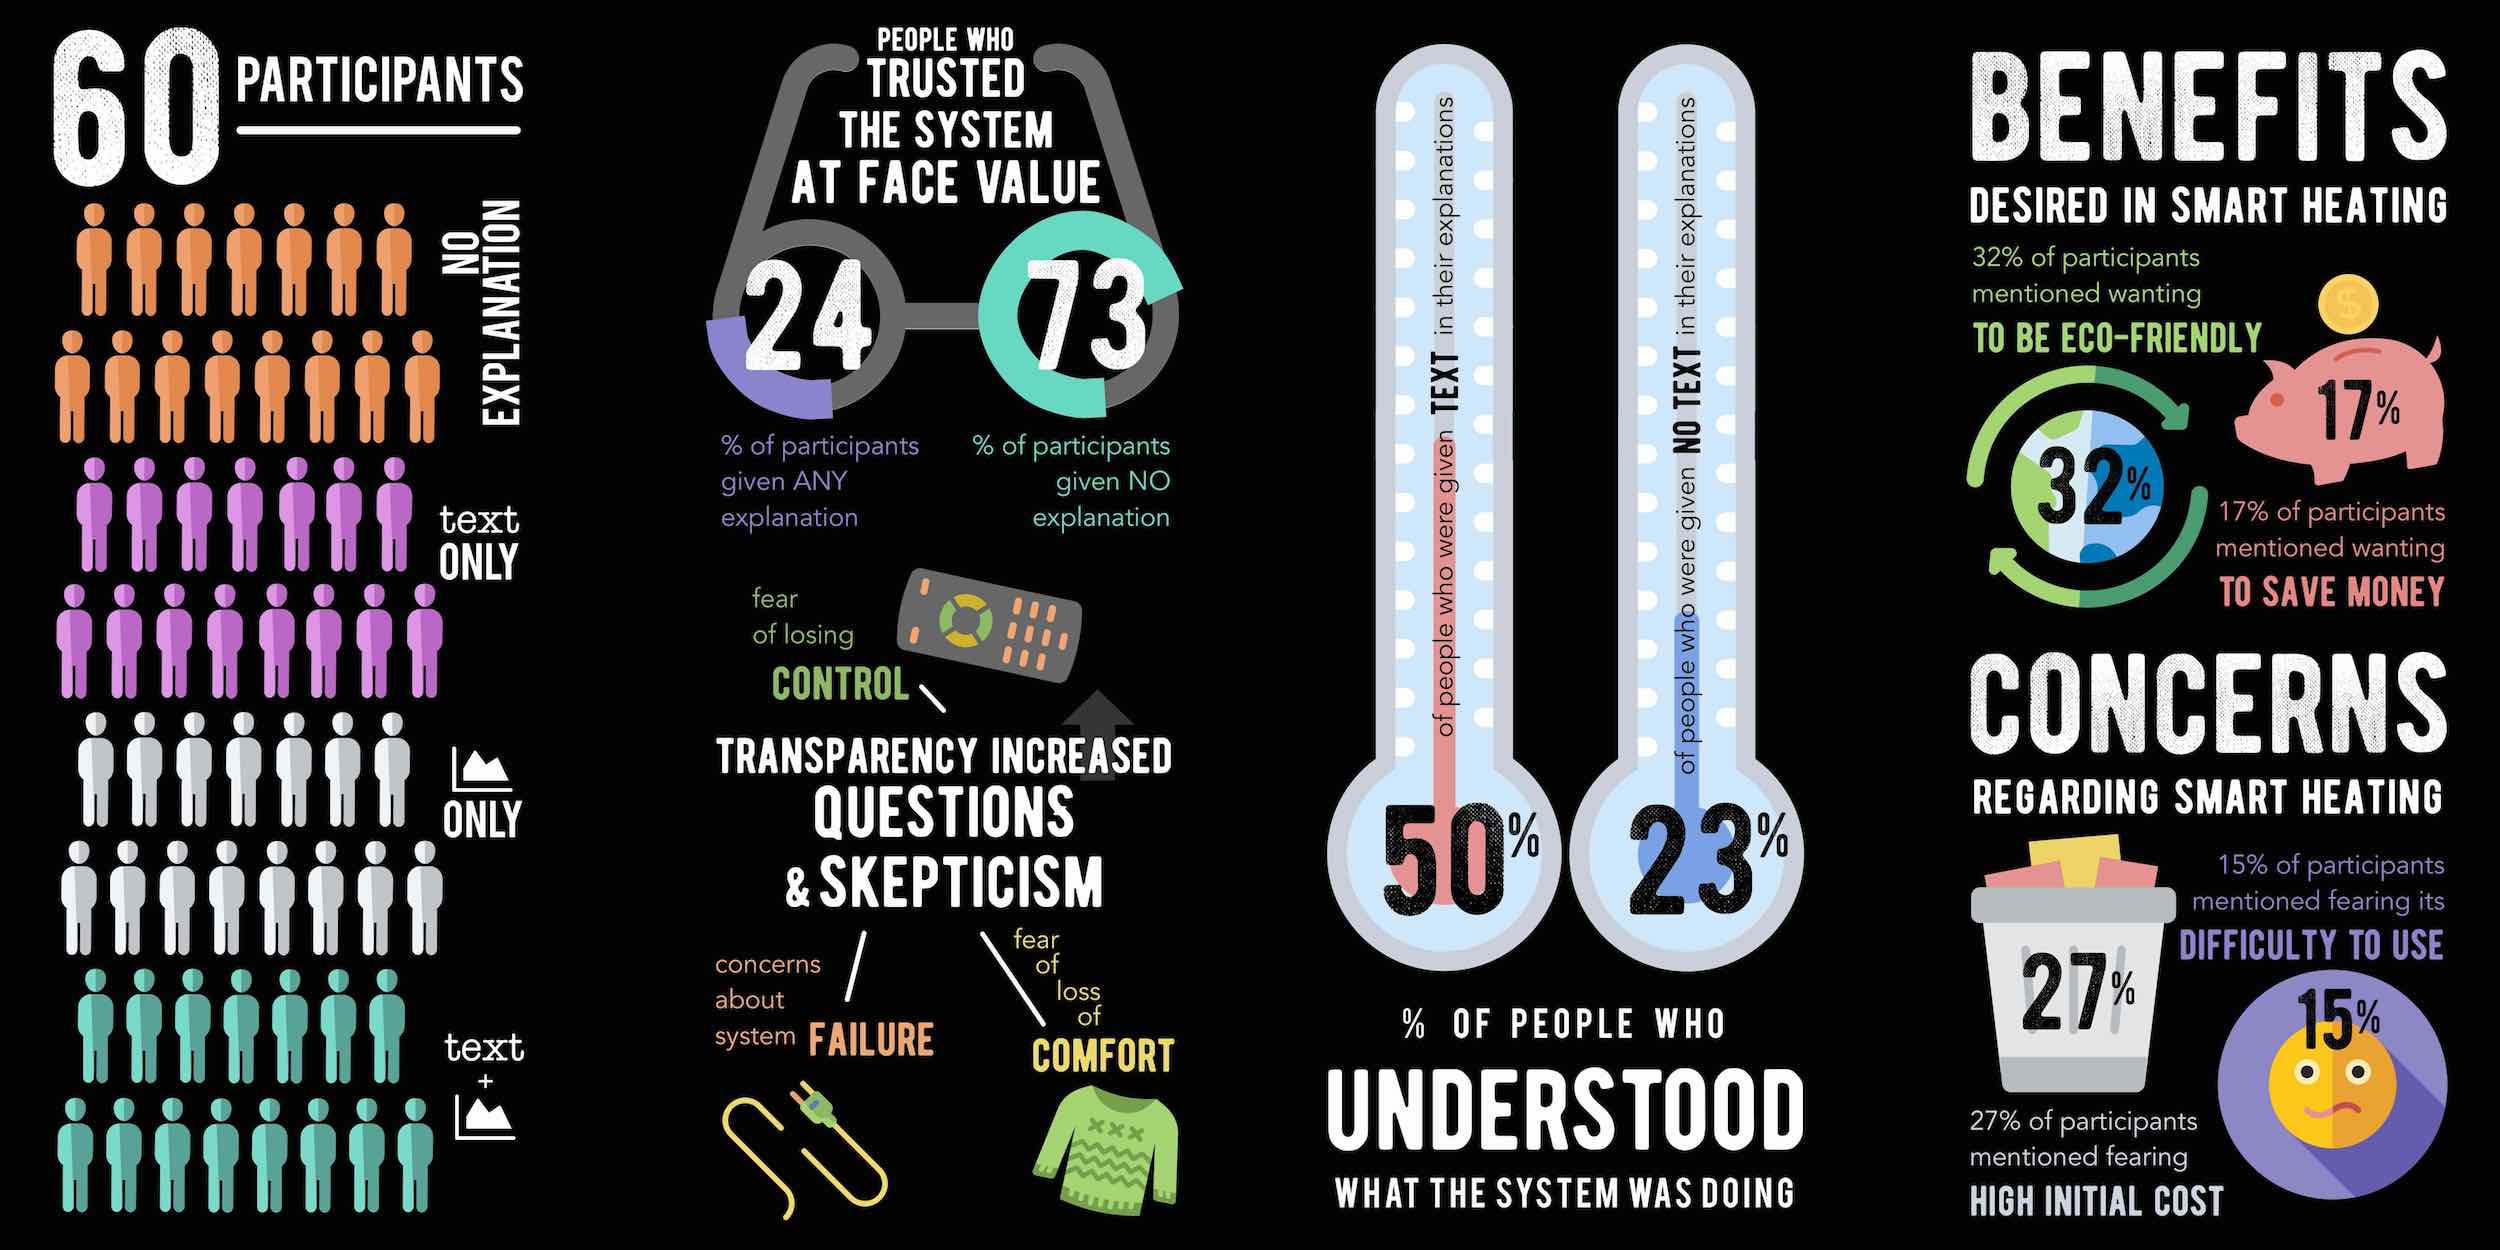
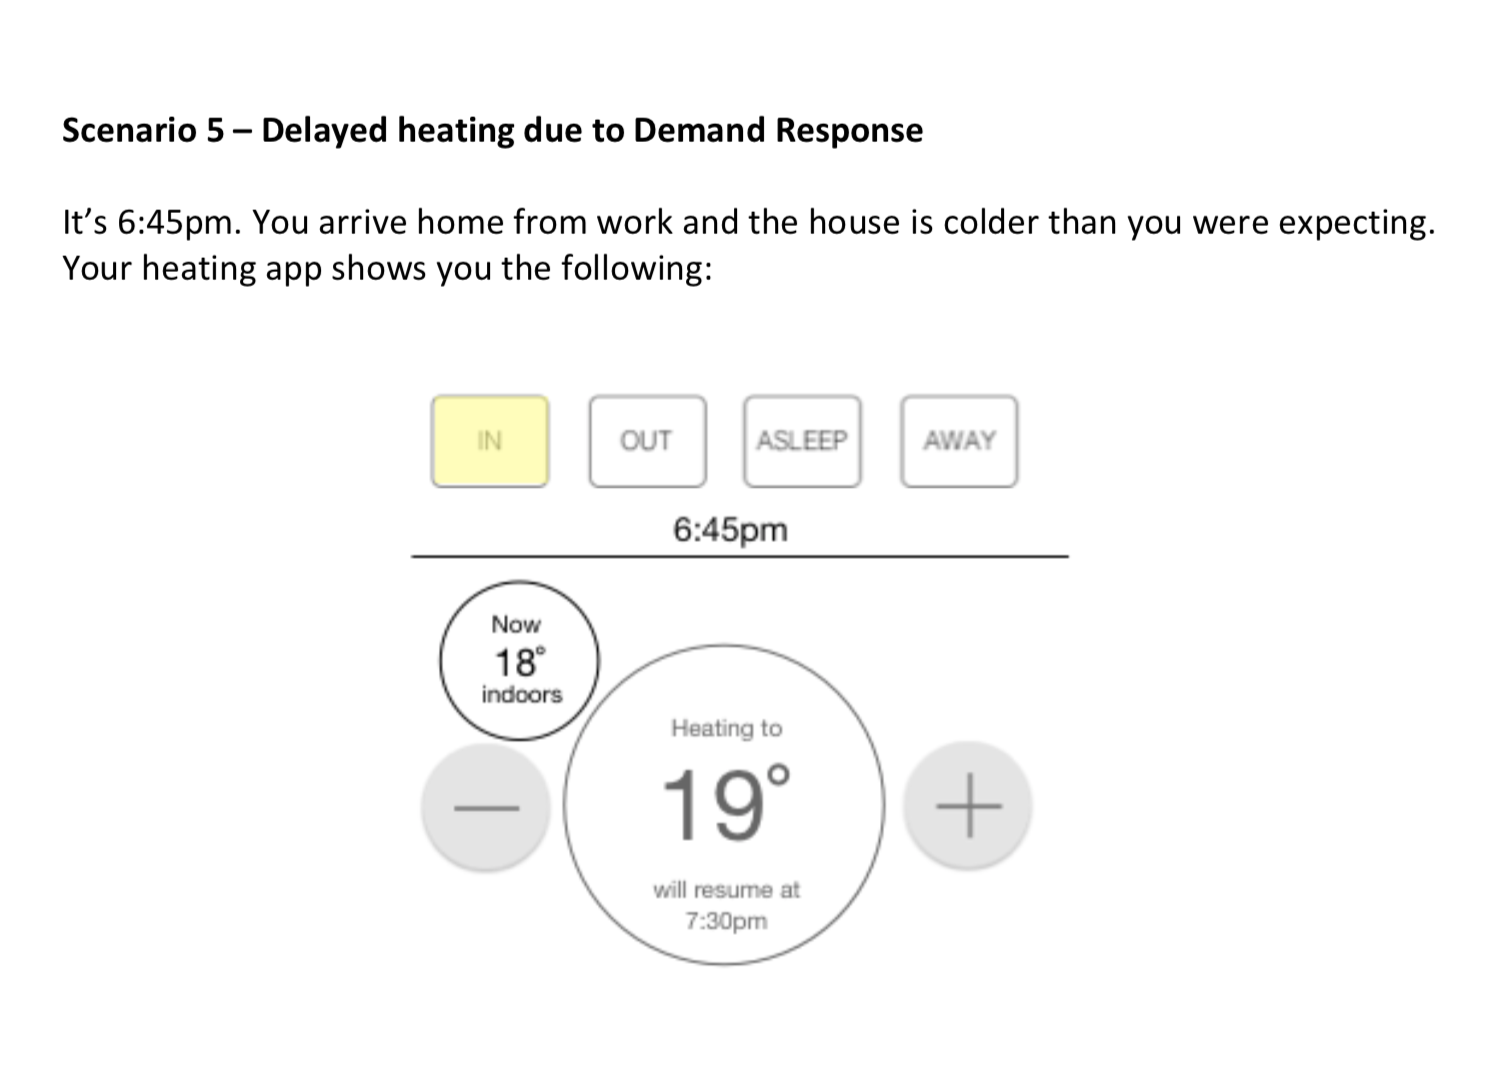
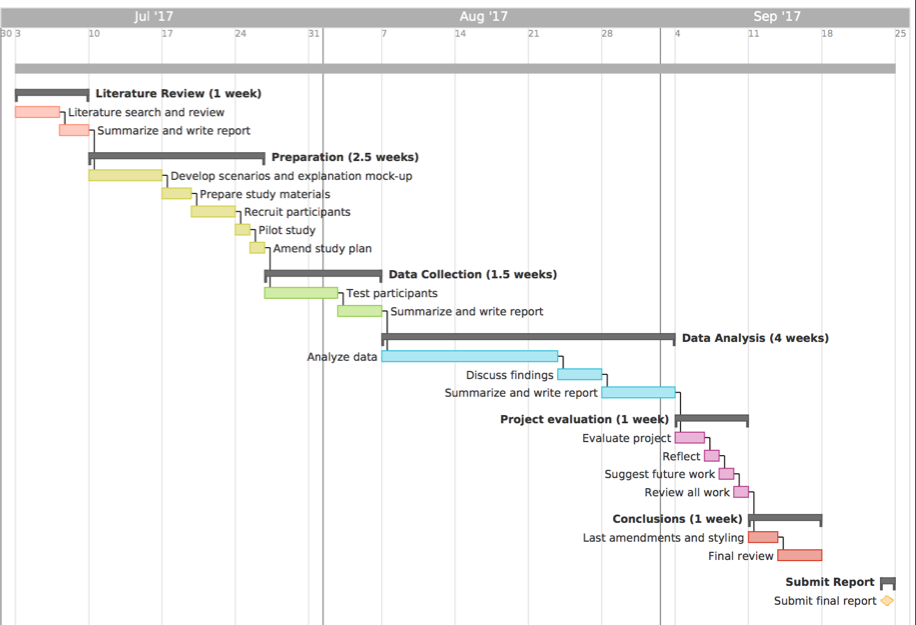
To test the effect of explanations on trust, I planned a remote, unmoderated experiment with 60 participants. I gave people scenarios in which their heating system is acting differently from their expectations and provided them with mocked-up screens of a heating user interface. I also asked them questions to assess their understanding and level of trust in the system. Finally, I analyzed participants' responses both quantitatively and qualitatively and wrote up a very long (and fascinating, I'm sure!) paper about my results.
Outcome
I found that explanations improved people's understanding of what the system was doing. Surprisingly, they did not change trust in the system; however, they did change the basis for participants' trust in this system from generic 'it seems smart' to specific concerns about the decisions being made. It turns out that the more people know about what's going on behind the scenes, the more opinions they have about whether those decisions are appropriate.
My findings will be published in the Workshop on Explainable Systems at the upcoming Intelligent User Interfaces conference. This project was part of the FREEDOM project, done by City University of London in cooperation with Passiv Systems Ltd and funded by Western Power Distribution and Wales and West Utilities.


